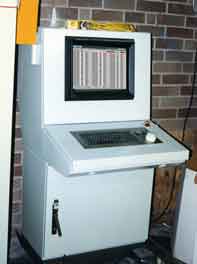
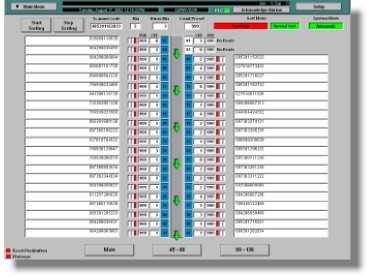
The graphical Operator Interface allows easy monitoring of a process or machine operation by displaying a pictorial graphic that shows the operation of the process. It allows an operator to manipulate the process and system components in an easy intuitive manner. What it doesn’t do well is gather data for analysis and informational purposes. To do that you need what is termed a SCADA system or Supervisory Control and Data Acquisition system.
A Supervisory Control and Data Acquisition system or SCADA system incorporates all the capabilities of the graphical Operator Interfaces described previously and adds the capability of logging data over time. Since they generally need a sizable place to store all this data, SCADA systems are usually implemented on PCs. PCs are generally not suited for industrial environments, but SCADA PCs can usually be located in a clean environment and connected via a communication link. There are industrial computers that have been designed around being located in industrial environments, but that is a discussion for another page…

Once again you jump in cost requirements, but you also make a jump in capabilities. The primary addition is the ability to log data and to display that logged data. With most SCADA systems you define what are termed “tags.” A tag is simply a link to the memory location, as described before, that has a name such as ‘VALVE_1.’ With the use of tags, you define the link to the memory location once and use it repeatedly throughout your application. A SCADA application will give you the capability to log that tag also. Many of the SCADA systems log data to a proprietary database and log samples based on either timed intervals or samples based on a change in value. Samples logged on a time base are easy to understand and manipulate. They log data at a fixed interval such as every second or every minute. With some data such as temperatures, the value might not change that often. A slow sample rate would be used to minimize the space required to store the data. Quickly moving variables such as a pressure signal may move very quickly requiring a fast sample rate in order to see a complete history of changes. To more efficiently log fast moving signals, a logging system based on a change in value may be more appropriate. These systems are set up with a dead band that the signal must exceed before any new data is logged. This allows the system to be very efficient with storage space as it only logs data that has changed by an amount that has been determined to be useful.  Once that dead band is exceeded the system will log large amounts of data very quickly in order to have good information about the change.
For example if we had that pressure signal and it happened to remain fairly stable at about 10 PSI, but if there was a problem we wanted to know exactly how it behaved. We might set up a dead band of 1 PSI and set it to log as quickly as possible on such an upset. During the stable times, the system would log very little. On an upset – say the pressure shot up to 100 PSI and back to 10 PSI in 2 seconds – the system would log as many data samples as it could capture in that 2 second interval. In other words as fast as it could write it would log. We would get a pretty good feel for how the pressure reacted during that upset with a minimum of storage capacity used during the stable times. With a time sample based system our information would be based on what the sample time was set to. If the controls specialist set the time interval to one minute or even 2 seconds we might miss the entire upset. Our data might look as if the system remained stable throughout the entire process. The down side of this logging method is manipulating the data with a spreadsheet, database program or external analysis package. Fortunately the data can be exported to a spreadsheet to look as if it was logged on a time-based manner for external analysis.